

Summary: The Yorkville real estate market ended on a high note in 2016. A luxury town home sold for over $5 million. Two houses leased for over $5000 per month. The average sales price & rental rate for condominium units continued to trend upwards. There are now nine active new condominium projects in the Yorkville area.
Yorkville Residential Freehold Homes
Sales Activity
The resale activity for houses in Yorkville was almost non-existent in the last quarter of 2016 with only one sale recorded for the period. The stunning & sophisticated 3-storey townhome on Scollard St had over 4,300 square feet. It was impeccably decorated, had an elevator, a roof top terrace, and courtyard. An oasis in the middle of Yorkville. It sold for over $5 million after 13 days on the market. With low to non-existant inventory, it continues to be a challenge for buyers to buy a house in Yorkville.
As a comparison, see table below for sales activity in the following select areas in the City of Toronto:
- Toronto C02 communities (Annex, Wychwood, Casa Loma, Yonge & St. Clair);
- Toronto Central communities; and
- City of Toronto.

Note. Sales # = Number of sales for that period. DOM = Average Days on Market.
Visit Toronto Real Estate Board (TREB) Maps for information on boundaries in these sub-regions.
Lease Activity
Two Yorkville houses leased in the fourth quarter of 2016. Both leases were on Bishop St at an average rental rate of $5,225 per month after 16 days on the market. Both houses were nicely renovated. The semi-detached house came with its own dedicated parking pad, which is very rare for this street. While the other house, a townhouse, offered dedicated street parking, it was impeccably renovated and commanded a slighly higher rental rate.Yorkville Existing Condominiums
Sales Activity
We analyzed the Yorkville condominium sales activity of 37 condominium buildings.There were as many 124 listings that resulted in 61 condominium sales in the last quarter of 2016. The average price was $1,155,307 after an average of 37 days on market. The range of selling prices was from $335,000 to $4.4 million.
As compared to the rest of Toronto, Yorkville condos sell at a much higher average price. Kindly refer to the table below for sales activity in the following select regions:
- Toronto C02 communities (Annex, Wychwood, Casa Loma, Yonge & St. Clair);
- Toronto Central communities; and
- City of Toronto.
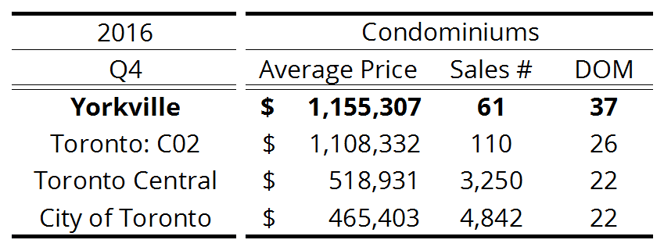
Note. Sales # = Number of sales for that period. DOM = Average Days on Market.
Visit Toronto Real Estate Board (TREB) Maps for information on boundaries in these sub-regions.
[Data provided by TREB]
Lease Activity
Urbanation Inc. tracks the rental activity across 3,170 units in 35 Yorkville condominiums. The fourth quarter saw 34 rentals with an average rental rate of $4,732 after 29 days on market. On a cost per square foot basis, the average rental rate was $3.89. A greater number of leases in luxury and high end buildings yielded a higher rental rate as compared to the previous quarter.New Yorkville Condominium Developments
There are nine (9) new condominium developments in Yorkville. These are all at various stages of sales, development, and construction. Two projects are now occupying and may register in 2017.
These new projects will deliver a total of 2,900 units over the next few years. As of this last quarter, 89% of these units have been pre-sold. As many as 105 units sold in the last quarter.
The average price for sold inventory was $917/sqft, while unsold inventory sits at an higher average price point of $1,158/sqft.
[Data provided by Urbanation]
