

Summary: The summer months of 2016 showed continued sales and leasing activity in the Yorkville house & condominium markets, though at a attenuated pace. With respect to new condominium developments, there are now seven (7) new projects at various stages of development and construction, with 91% of units being pre-sold.
Yorkville Residential Freehold Homes
Sales Activity
Three listings in the third quarter of 2016 resulted in 3 sales with an average selling price of $1,187,333 over 18 days. Two were semi-detached, and one was a row house.
These selling prices are lower than the typical Yorkville home. All three homes were on Bishop St, with no allocated parking, and limited street parking. Generally speaking, homes on Bishop are more affordable. They provide a more attractive price point than the rest of the Yorkville housing market.
Sales activity for Yorkville and the following select areas in the City of Toronto can be seen in the table below:
- Toronto C02 communities (Annex, Wychwood, Casa Loma, Yonge & St. Clair);
- Toronto Central communities; and
- City of Toronto.

Visit the Toronto Real Estate Board (TREB) Maps for information on boundaries in these sub-regions.
Lease Activity
Three self-contained apartments leased in the third quarter of 2016. The average rental rate was $2,127/month. This average rate is quite low for the area. Two apartements were 1 bedroom units, and the other was a 2 bedroom. Also, 2 of the 3 were on commercial streets. Apartment rentals in low-rise homes offer a more affordable rental rate.
As many as 5 freehold homes were also available for rent during the same period, though none of them leased.
Yorkville Existing Condominiums
Sales Activity
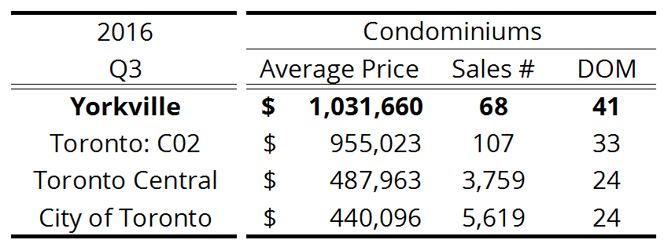
We analyzed the Yorkville condominium sales activity of 37 condominium buildings. There were as many as 145 condominium listings in the third quarter of 2016, resulting in 68 sales. The average price point was $1,031,660 with an average of 41 days on market to sell.
There were a wide of range of selling price points: from $295,000 to $4.5 million.
As compared to the rest of Toronto, Yorkville condos sell at a much higher average price point. Kindly refer to the table below for sales activity in the following select regions:
- Toronto C02 communities (Annex, Wychwood, Casa Loma, Yonge & St. Clair);
- Toronto Central communities; and
- City of Toronto.
Visit the Toronto Real Estate Board (TREB) Maps for information on boundaries in these sub-regions.
[Data provided by TREB]
Lease Activity
Urbanation Inc. tracks the rental activity across 3,170 units in 35 Yorkville condominiums. The third quarter saw 82 rentals with an average rental rate of $2,899 and 21 days on market. On a cost per square foot basis, the average rental rate was $3.47.
New Yorkville Condominium Developments
Toronto builders have as many as 7 new ongoing condominium developments. These are at various stages of sales, development and construction.
These new projects will deliver at total of 2,811 units over the next few years. As of this last quarter, 91% of these units have been pre-sold. As many as 293 units sold in the last quarter.
The average selling price for sold inventory is $903/sqft, while unsold inventory sits at an average higher price point of $1,201/sqft.
[Data provided by Urbanation Inc.]
